Titanic Passenger Data Analysis
A modular Python project exploring the Titanic dataset through data cleaning, exploratory data analysis, and visualization.
Overview
This project analyzes passenger information from the Titanic dataset to explore the factors that influenced survival outcomes.
The analysis focuses on variables such as gender, age group, embarkation port, and passenger class. It combines data preprocessing, exploratory analysis, and visualization to identify patterns in survival probability.
The project was first developed in a notebook-based workflow and then progressively refactored into reusable Python modules to improve readability, maintainability, and reproducibility.
Features
- Modular Python project structure
- Data loading and preprocessing
- Survival analysis by:
- Gender
- Age group
- Embarkation port
- Passenger class
- Automatic chart generation with Matplotlib
- Separation between analysis logic and execution workflow
Technical Stack
- Python
- Pandas
- NumPy
- Matplotlib
- Jupyter Notebook
Example Analyses
The project compares survival rates across different passenger groups and visualizes the results using pie charts.
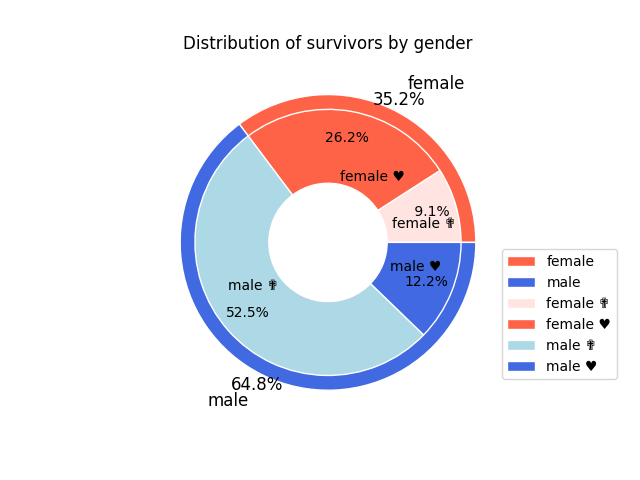
Survival Rate by Gender
The analysis investigates survival probability across different genders.
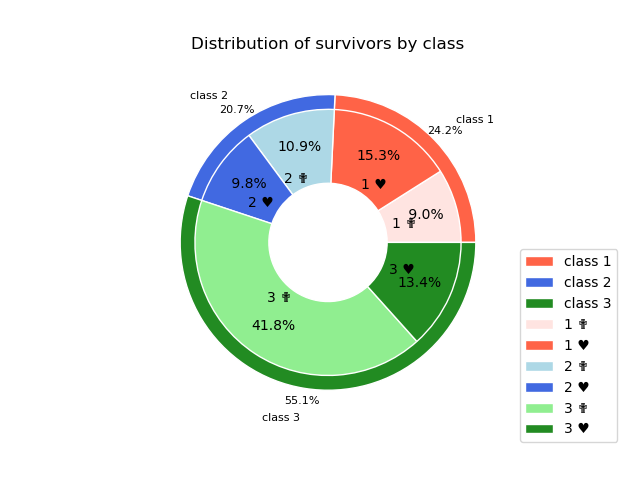
Survival Rate by Passenger Class
The analysis investigates how ticket class influenced survival probability.
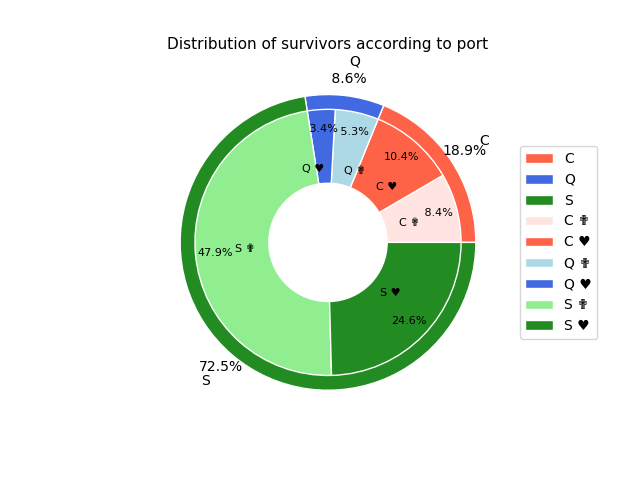
Survival Rate by Embarkation Port
Passenger survival is compared across embarkation locations (C, Q, S).